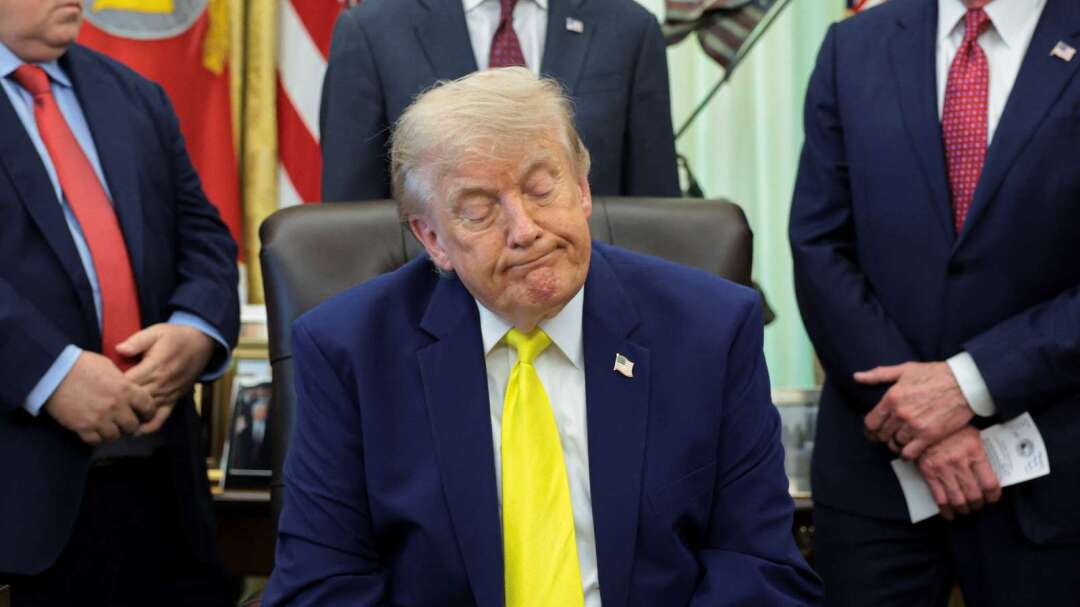
The U.S. military's actions against Iran have continued for nearly two weeks. As the conflict remains deadlocked, a geopolitical advisory firm is attempting to 'quantify' President Trump's decision-making psychology using a mathematical model—and even estimating when he might choose to de-escalate militarily, known as 'TACO.' The most likely date, according to the analysis, is Sunday, July 26.
On July 24, Trump discussed the potential conclusion of the conflict with Iran at the White House, stating that the U.S. faces only two options: continuing or intensifying military strikes to further weaken Iran's military capabilities, or shifting toward negotiations to reach a diplomatic resolution.
Earlier that day, Reuters cited sources indicating that Pakistan is mediating to restart the stalled U.S.-Iran talks.
Markets quickly reacted to the diplomatic possibility, sending oil prices sharply lower. Brent crude briefly dipped below $95.20 per barrel, a single-day drop exceeding 5%. U.S. West Texas Intermediate (WTI) crude also fell below $87.70, down nearly 4.9%.
As markets watch with bated breath, geopolitical advisory firm Signum has introduced a more provocative analytical framework: the 'TACO Index.'
The name is a satirical nod to the Wall Street quip 'Trump Always Chickens Out,' used to describe his recurring behavior pattern under high-pressure situations.
Led by analyst Andrew Bishop, the team points out that historical data shows Trump almost always opts for policy de-escalation whenever the composite market stress indicator reaches approximately 2.9 standard deviations.
Linearly extrapolating from current market trends, this so-called 'TACO Moment' could arrive as early as July 22 and no later than July 30, with the team identifying Sunday, July 26, as the most probable date.
The model is not baseless speculation. Signum's team selected March 7 of this year—about one week after the U.S. and Israel resumed strikes on Iran—as the baseline observation point. They weighted and integrated four key indicators: Brent crude oil prices, U.S. 10-year Treasury yields, the number of vessels passing through the Strait of Hormuz, and the S&P 500 index—assigning different weights based on Trump's sensitivity to each.
To test the model's reliability, analysts reviewed three key policy shifts by Trump since then: his shift toward supporting ceasefire talks on March 22, acceptance of a ceasefire agreement on April 7, and the May 18 pivot to focusing negotiations on a memorandum of understanding.
The results showed that the market stress threshold triggering Trump's actions generally falls between 2.3 and 3.4 standard deviations, with an average near 2.9.
While the backtesting results appear precise, Bishop's team acknowledges significant limitations. 'TACO' has become a popular market meme among investors, but as a predictive tool, its accuracy has historically been inconsistent.
More critically, the current U.S. military campaign against Iran—led by Trump—is widely seen as having limited prospects for success, involving far more complex variables than a few financial metrics.
Ultimately, Signum's model systematizes Trump's past sensitivity to market signals. However, political decisions are often filled with nonlinear, sudden turns, and any prediction based on extrapolating historical patterns carries substantial uncertainty. Analysts caution investors to maintain appropriate risk awareness if using this index for trading decisions.
FACT BOX
- Source: PR Times
- Category: Survey
- Organizations: Signum / Reuters