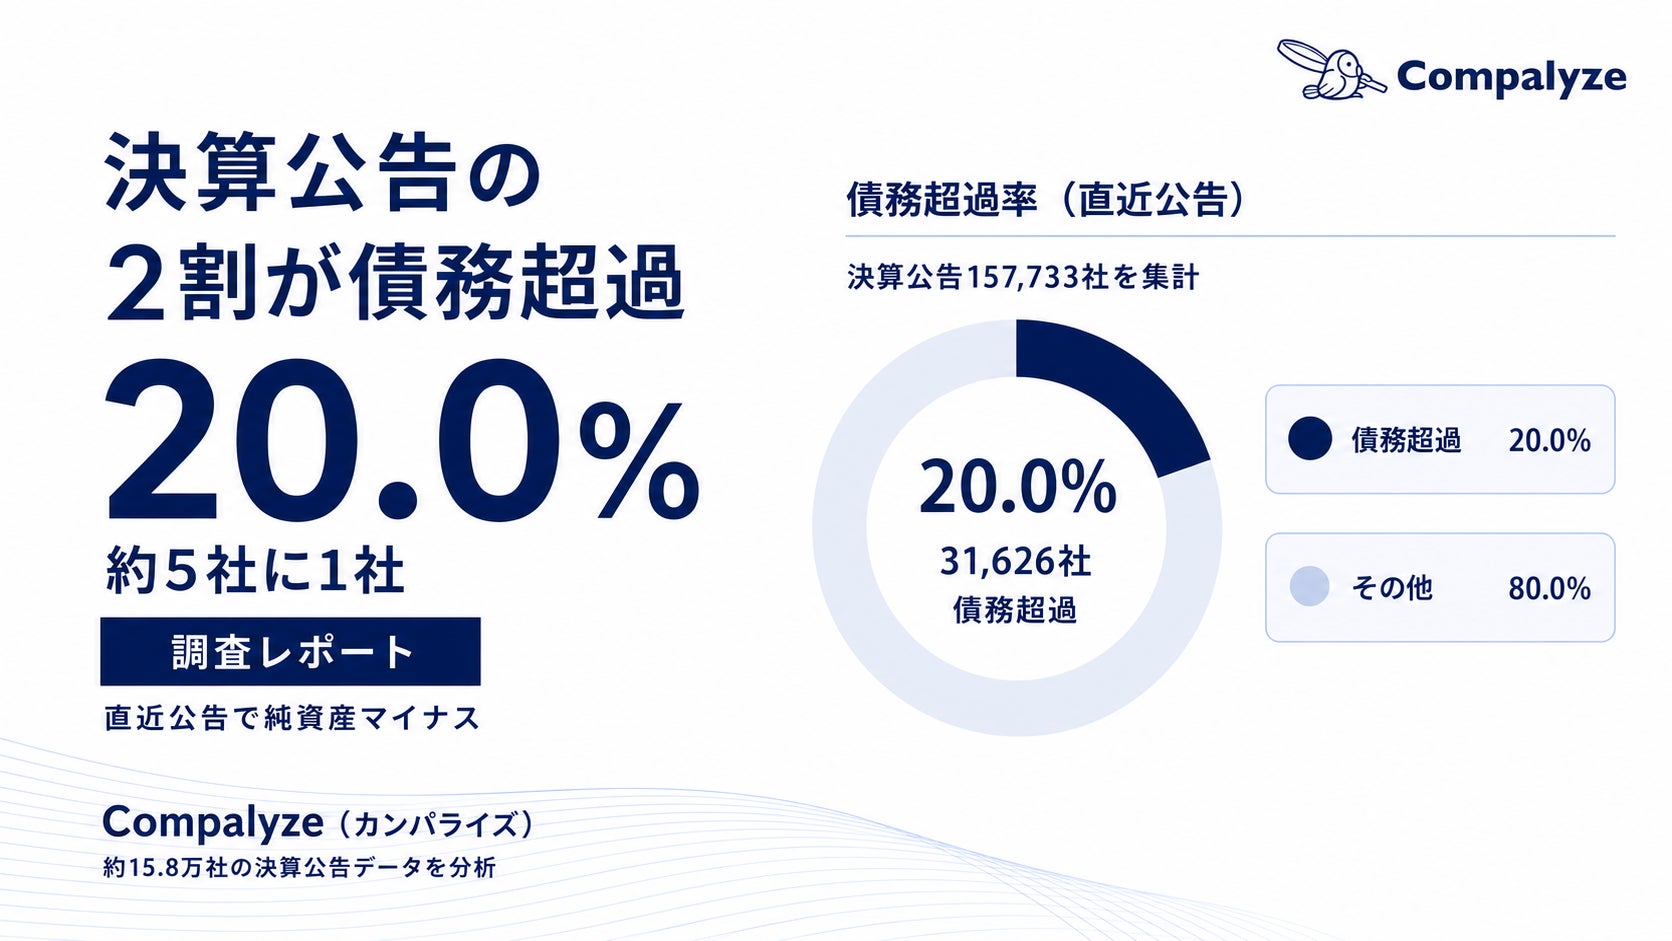
Compalyze Inc. (headquartered in Kusatsu City, Shiga Prefecture; CEO: Takashi Suzuki), operator of the corporate database 'Compalyze,' conducted a survey analyzing the net assets of approximately 158,000 companies (157,733) nationwide for which financial statements were confirmed via official gazette announcements.
The results show that 20.0% (31,626 companies) had negative net assets (insolvent) in their most recent announcement—about one in five companies. However, insolvency does not equate to bankruptcy; it is an accounting condition where liabilities exceed assets. Longitudinal tracking reveals that some companies recover while others decline, with patterns differing by industry.
Data Citation Request
When citing or using this survey data, please clearly state the following URL and source:
URL: https://compalyze.co.jp/journal/insolvency-rate-by-industry
Source: Corporate Survey: 20% of 158,000 Companies in Financial Statements Are Insolvent — Tracking Industry Differences in Recovery and Ongoing Deficits Post-Pandemic
Survey Summary
Among approximately 158,000 companies (157,733) with confirmed financial statements, 20.0% (31,626) were insolvent (negative net assets) in their latest announcement—about one in five.
By industry, Food & Beverage and Travel, Tourism & Accommodation had the highest rate at 21.5%, 4.4 times higher than the lowest, Financial & Insurance (4.9%). Wholesale & Trading (5.4%), Construction & Civil Engineering (5.6%), and Real Estate (6.4%) followed.
Insolvency falls into three types: (1) core business losses reducing equity, (2) front-loaded investments during startup or growth phase, and (3) capital structures designed under parent company support. Industry-level figures likely reflect a mix of these.
The latest announcement shows a 20.0% insolvency rate, while annual announcements show 10–11%. This gap likely stems from insolvent companies often ceasing to publish financial statements.
For companies insolvent during the pandemic (2020–2022), outcomes were: recovered (13%), ongoing insolvency (19%), no further announcements (68%). Among those continuing announcements (~4,000 companies), 40% recovered, 60% remained insolvent. Recovery rates varied by industry: Information Technology (49%), Travel, Tourism & Accommodation (34%).
Peak insolvency occurs not at startup but at 6–10 years after establishment (27.6%). It concentrates among companies with 10 or fewer employees (25.7%) and is rare in those with over 1,000 employees (1.6%).
One in Five Companies Is Insolvent — But Not Necessarily Bankrupt
A key indicator of corporate financial health is whether net assets are positive or negative. Compalyze’s analysis of official gazette financial statements found that 20.0% (31,626 of 157,733) of companies with confirmed statements had negative net assets in their latest announcement—about one in five. However, insolvency is not bankruptcy. It is an accounting state where liabilities exceed assets on the balance sheet at a point in time, and even ongoing businesses can be insolvent.
Proportion of insolvent companies among those with confirmed financial statements (Compalyze survey)
Industry Differences of Up to 4.4x — Food & Beverage and Travel Sectors Highest
Insolvency rates vary significantly by industry. The highest are Food & Beverage and Travel, Tourism & Accommodation, both at 21.5%, followed by Education & Training (21.1%) and Healthcare (19.0%). The lowest are Financial & Insurance (4.9%), Wholesale & Trading (5.4%), Construction & Civil Engineering (5.6%), and Real Estate (6.4%). The gap between highest and lowest is about 4.4 times.
Industries with high debt-financed investments (e.g., restaurants, travel, accommodation) or high initial burdens (e.g., medical startups) show higher rates. In contrast, Financial (due to capital regulations), Real Estate (due to collateral assets), and Construction/Wholesale (due to prepayments and inventory turnover reducing fixed asset burdens) show lower rates. These financial differences appear more structural—based on business type—than managerial.
Industry-Specific Insolvency Rates (trend values based on industries with 500+ companies. Compalyze survey)
Insolvency Falls into Three Types
Interpreting industry insolvency rates as direct measures of 'unstable management' risks misreading reality, as insolvency manifests in at least three distinct forms.
First, sustained core business losses eroding equity—common in capital-intensive sectors like food, accommodation, and manufacturing. Second, front-loaded investments during startup or growth phases—seen in IT, media, and healthcare startups aiming for IPOs or expansion. Third, thin standalone capitalization under parent company support—typical of listed subsidiaries or foreign-affiliated Japanese entities. Industry-level insolvency rates must be interpreted as a composite of these three types.
20% (Latest) vs. 10% (Annual) — Insolvent Firms Often Stop Announcing
The way data is presented matters. The '20% insolvent in latest announcement' figure aggregates the most recent filings from all companies.
In contrast, looking only at announcements from a single year, insolvency rates remain at 10–11%. From 2018 to 2024, annual rates stayed within this range. The discrepancy—10% annually vs. 20% in latest data—arises because once a company becomes insolvent, it often stops filing. Companies that recover continue announcing; those that don’t fade from view, leaving their last (insolvent) statement as the latest record. This asymmetry is the primary reason for the 20% figure.
What Happens After Insolvency? — 40% of Continuing Firms Recover
What is the trajectory of companies that become insolvent?
Compalyze maintains longitudinal financial data (about 41% of companies have two or more periods available). Using this, we tracked 12,404 companies that were insolvent between 2020 and 2022.
By the latest period, 13% had 'recovered' (net assets positive), 19% remained 'insolvent,' and 68% had 'no further announcements.' 'No announcements' does not necessarily mean bankruptcy—it may include delisting or becoming a subsidiary. Among companies that continued announcing (~4,000), 40% recovered, 60% remained insolvent.
Recovery rates vary by industry: Information Technology recovered at 49%, while Travel, Tourism & Accommodation reached only 34%. Losses from growth investments tend to resolve faster, while industries with pandemic-diminished equity face slower recovery. Even under insolvency, post-crisis trajectories diverge by sector.
2020–2022 Insolvent Companies: Outcomes and Industry Recovery Rates (Compalyze survey)
Insolvency Peaks at 6–10 Years, Amounts Typically in Tens of Millions of Yen
Breaking down by company age, size, and amount reveals deeper trends. Insolvency rates by age: 21.2% for startups (0–5 years), peaking at 27.6% for 6–10 years, then declining to 14.8% (11–20 years) and 6.2% (21+ years). Peak insolvency occurs not at inception but after 6–10 years.
By size, insolvency skews toward small firms: 25.7% for 10 or fewer employees, 4.6% for 100–1,000 employees, and 1.6% for over 1,000 employees.
FACT BOX
- Source: PR TIMES
- Category: Survey
- Products / services: Compalyze