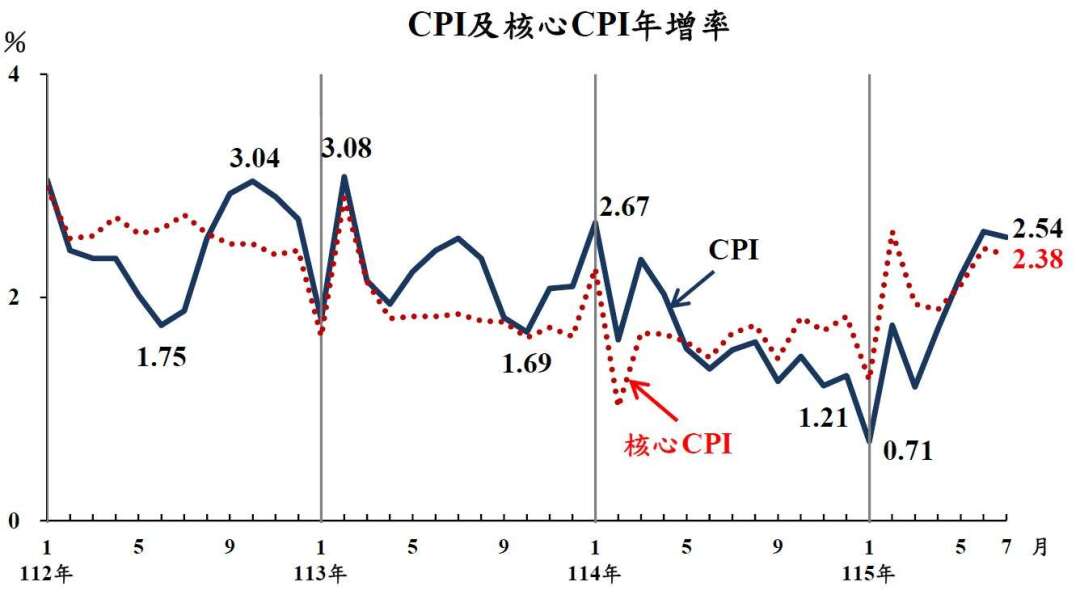
The Directorate-General of Budget, Accounting and Statistics (DGBAS) released today (6th) the price movement overview for July 2026. The Consumer Price Index (CPI) rose 2.54% year-on-year in July—slightly lower than June but marking the third consecutive month above the 2% inflation alert line. DGBAS stated that typhoons and heavy rains pushed up fruit and vegetable prices, while the summer travel season led to higher tour package fees and airfare. Continued increases in dining-out expenses and rental costs further contributed to persistent inflationary pressure. Core CPI, which excludes fresh produce and energy, rose 2.38% year-on-year. The average increase over the first seven months stood at 1.81%, indicating that domestic inflation remains stubborn.
DGBAS explained that back-to-back typhoons and torrential rains in June and July reduced harvest volumes, driving up prices for fruits and vegetables. Strong demand during the summer vacation period also elevated both domestic and international tour fees and airfares. Additionally, ongoing price hikes in dining out, rent, electricity, and fuel costs have continued to burden household budgets.
Among the seven major expenditure categories, miscellaneous goods recorded the highest year-on-year increase at 3.27%, primarily due to persistently high international gold prices, which pushed personal accessories like jewelry and gold items up by 11.99%. Education and recreation followed with a 3.22% rise, fueled by robust summer travel demand: overseas tour packages jumped 5.73%, and educational devices such as computers rose 8.23%. Transportation and communication costs increased 2.72%, driven by an 11.16% rise in fuel prices and a 12.27% surge in airfares due to higher international fuel surcharges. However, car prices fell 2.21% due to reduced commodity taxes, partially offsetting overall gains.
Food prices rose 2.49% year-on-year in July. Vegetables climbed 3.78% due to Typhoon Bavi and heavy rains, while egg and seafood prices rose 7.97% and 4.40%, respectively. Dining-out costs continued to rise, increasing 3.05%. Fruit prices, however, declined 3.02% due to a high base from the same period last year. Housing-related costs rose 2.32% year-on-year, with rents continuing their upward trend at 1.73%. Gas, household management fees, and electricity prices increased 7.63%, 4.66%, and 4.47%, respectively. Among individual surveyed items, cabbage prices surged 26.47%, while Chinese breakfast meals, boxed lunches, and noodles all rose over 3.6%.
On producer and trade price fronts, the Producer Price Index (PPI) soared 16.94% year-on-year in July, with an average increase of 7.93% over the first seven months. This was mainly driven by rising prices for computer and electronic products and petrochemical materials. The Import Price Index (IPI) and Export Price Index (EPI), measured in U.S. dollars, rose 16.64% and 19.71% year-on-year, respectively, reflecting soaring global raw material and electronic equipment prices.
By income level, high-income households saw a CPI increase of 2.72% in July, surpassing the 2.46% rise for middle-income and 2.40% for low-income households. This is attributed to higher spending weights on travel, entertainment, and miscellaneous goods among wealthier families. Elderly households recorded a 2.44% year-on-year CPI rise. Overall, despite some price declines in certain goods, the significant increases in service-sector and essential living costs mean inflationary pressure will likely persist in the short term.
FACT BOX
- Source: PR Times
- Category: Survey