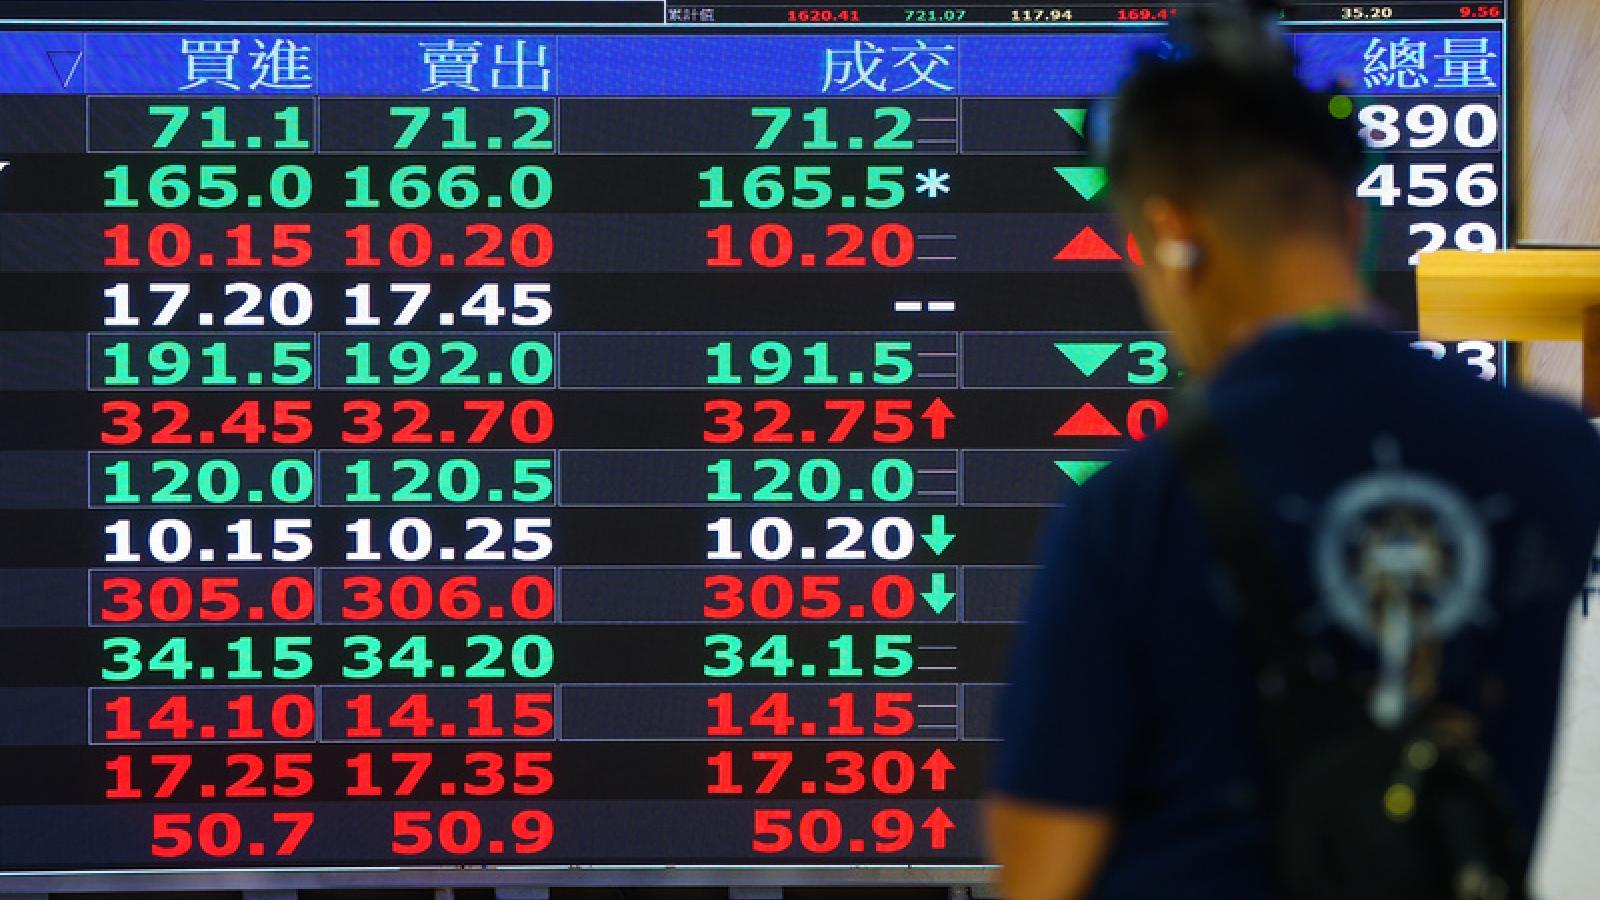
After reaching a peak in late June, Taiwan's stock market faced sharp declines in July due to various factors, causing all ETFs to retreat. However, the market gradually warmed up in August, and today (the 13th), it opened higher with volatile trading, jumping 623 points and briefly reclaiming the 46,000-point mark.
In response, financial expert Ruan Mu-Hua posted on Facebook, revealing a comprehensive statistical analysis of the "lost ground recovery rate" for 40 passive Taiwan stock ETFs from the previous market turbulence to the closing on August 11. The results showed a clear three-tier structure, with 00918 achieving the highest recovery rate at 147.7%.
Which ETFs stabilized first? A shallow decline proved to be the key factor in regaining lost ground.
Taiwan's stock market experienced a major correction in July, with tech stocks and large-cap names such as TSMC, MediaTek, and Yageo suffering broad sell-offs. ETFs were not spared. Ruan conducted a survey of 40 passive Taiwan stock ETFs—20 high-dividend, 12 market-cap weighted, and 8 semiconductor-focused—using the drop from their June highs to their lowest points as a baseline. He then examined their "recovery rate" as of the August 11 close, revealing a distinct three-layer structure.
According to Ruan, the top six ETFs by recovery rate were:
1. Dahua Premium High Dividend 30 (00918): 147.7% 2. Uni-President Taiwan High Yield Momentum (00939): 133% 3. Fubon Premium Dividend Stock (00907): 116.4% 4. Mega Financial Blue-Chip Equal Weight (00921): 96.7% 5. Fuhwa FTSE High Dividend Low Volatility (00731): 88.9% 6. CTBC Growth High Dividend (00934): 83.5%
00918 and 00907 reached new highs after ex-dividend; 0050 and 006208 saw recovery rates around 60%
Ruan noted that the top three ETFs have already surpassed their June highs, with 00918 and 00907 even setting new highs after going ex-dividend, demonstrating both dividend capture and downside resilience. The common trait among these leaders was minimal drawdown—only 3% to 5% during the correction—thanks to low-volatility strategies and heavy weighting in traditional industries and financial stocks, which provided strong defensive characteristics.
Notably, 00921 ranked fourth, the only market-cap type ETF to enter the top tier. Its equal-weight design diluted the impact of dominant electronics stocks, resulting in a mere 8.9% drawdown—far below the 16% to 17% seen in traditional market-cap ETFs like 0050 and 006208—leading to naturally faster recovery. In contrast, mainstream market-cap ETFs had recovery rates between 57% and 69%, delivering average performance.
At the bottom remained semiconductor ETFs. All eight semiconductor ETFs fell 20% to 35%, with recovery rates ranging from 41% to 59%, occupying the lower end of the rankings. Taiwan New IC Design (00947) suffered the deepest fall at 34.6%. Moreover, high-dividend ETFs also showed clear divergence: those with higher exposure to tech and electronics stocks, such as 00929, 00930, and 00900, had recovery rates of only 43% to 52%, significantly lagging behind traditional-sector high-yield ETFs. This highlights that beneath the "high-dividend" label, the actual portfolio composition determines true downside resilience.
Ruan emphasized that overall, this correction reaffirmed the rule: "shallow falls lead to fast recoveries." Defensive high-dividend and equal-weight strategies emerged victorious. While semiconductor ETFs possess strong rebound potential, they still need time to regain prior highs. Investors reviewing their ETF holdings should look beyond names and carefully examine the sector composition of underlying holdings.
FACT BOX
- Source: PR Times
- Category: Survey
- Products / services: ETF